Who We Are

We are Optimum BH - A cutting edge software development agency specializing in Full-stack development with a focus on web and mobile applications built on top of PETAL stack.

What We Do

At Optimum BH, we are dedicated to pushing the boundaries of software development, delivering solutions that empower businesses to thrive in the digital landscape.

Web app development

We create dynamic and user-friendly web applications tailored to meet your specific needs and objectives.

Mobile app development

We design and develop mobile applications that captivate users, delivering an unparalleled experience across iOS and Android platforms.

Maintenance and support

Our commitment doesn't end with deployment. We provide ongoing maintenance and support to ensure your applications remain up-to-date, secure, and optimized for peak performance.

Blog Articles

Post Image

Client vs Server side interactions in Phoenix LiveView

The effectiveness of server-side frameworks like Phoenix LiveView for creating fully interactive web applications has sparked considerable debate, as seen in discussions such as these: https://x.com/t3dotgg/status/1796850200528732192 https://x.com/josevalim/status/1798008439895195960 While Phoenix LiveView can achieve significant functionality independently, the strategic decision of when to initiate server round trips becomes crucial for crafting truly interactive web experiences. This post explores the dynamics of client-side versus server-side interactions within Phoenix LiveView. Client vs Server To ensure a smooth user experience, it's crucial to determine which interactions require minimal latency. For instance, actions like dragging and dropping elements across a screen or dynamically creating UI components should be executed without delay; otherwise, your application may feel sluggish and unresponsive. Thus, the decision between client-side and server-side processing hinges on understanding when each approach is most appropriate. Showing and Hiding Content: For interactions such as displaying modals or toggling visibility based on user actions (e.g. clicking a button), handling these tasks on the client side is generally preferable. This approach is suitable unless: The content must be dynamically loaded to optimize network or application load. The interaction requires state changes that must be synchronized with the backend. Example: On a settings page, showing a modal when a user clicks "Change Email Address" can be managed client-side. Showing form in a modal from client-side However, triggering a confirmation message after sending an email with a verification link typically involves a backend state change, making it appropriate for server-side handling. Showing a success message from server-side Zero Latency Demands: Interactions that demand instant responsiveness, such as drag-and-drop interfaces, should primarily be managed client-side to ensure a seamless user experience. Server-Side Necessity: Any interaction that inherently involves the server should be handled server-side. Examples include: Uploading files. Saving data to a database. Broadcasting messages to other clients with Phoenix PubSub. By discerning when to delegate tasks to the client versus the server, applications can optimize performance and responsiveness, delivering an intuitive user experience across various functionalities. How to build a rich client experience in Liveview? LiveView provides developers with convenient ways to incorporate JavaScript code when building interactive applications. Here are some of the available options: LiveView.JS The Phoenix.LiveView.JS module enables developers to seamlessly integrate JavaScript functionality into Elixir code, offering commands for executing essential client-side operations. These commands support common tasks such as toggling CSS classes, dispatching DOM events, etc. While these operations can be accomplished via client-side hooks, JS commands are DOM-patch aware, so operations applied by the JS APIs will stick to elements across patches from the server. https://hexdocs.pm/phoenix_live_view/Phoenix.LiveView.JS.html In addition to purely client-side utilities, the JS commands include a rich push API, for extending the default phx-binding pushes with options to customize targets, loading states, and additional payload values. Below is an example demonstrating how to utilize these commands to dynamically apply styles while showing and hiding a modal. <a phx-click={show_settings_modal("change-email-modal")} > Change email address </a> def show_settings_modal(modal) do %JS{} |> JS.add_class("blur-md pointer-events-none", to: ".settings-container") |> JS.show(to: "##{modal}") end JS Hooks A Javascript object provided by phx-hook implementing methods like: mounted(), updated(), beforeUpdate(), destroyed(), disconnected(), reconnected(). For example, one can implement a reorderable drag-and-drop list using Hooks. import Sortablelet Hooks = {} Hooks.Sortable = { mounted(){ let group = this.el.dataset.group let isDragging = false this.el.addEventListener("focusout", e => isDragging && e.stopImmediatePropagation()) let sorter = new Sortable(this.el, { group: group ? {name: group, pull: true, put: true} : undefined, animation: 150, dragClass: "drag-item", ghostClass: "drag-ghost", onStart: e => isDragging = true, // prevent phx-blur from firing while dragging onEnd: e => { isDragging = false let params = {old: e.oldIndex, new: e.newIndex, to: e.to.dataset, ...e.item.dataset} this.pushEventTo(this.el, this.el.dataset["drop"] || "reposition", params) } }) } } let liveSocket = new LiveSocket("/live", Socket, {params: {_csrf_token: csrfToken}, hooks: Hooks}) def render(assigns) do ~H""" <div id="drag-and-drop" phx-hook="Sortable"> ... </div> """ end Learn more about hooks: Client hooks via phx-hook Why is LiveView not a zero-JS framework but a zero-boring-JS framework? Building a simple countdown timer app with LiveView Alpine.js Alpine.js is well-suited for developing LiveView-like applications. While many features of Alpine.js can now be achieved using LiveView.JS or Hooks, it remains prevalent in numerous codebases, especially those originally built on the popular PETAL stack during the earlier days of Phoenix LiveView. Alpine.js is still useful for handling events not covered with LiveView.JS. Here's an example demonstrating Alpine.js usage to toggle and transition components: <div x-data="{ isOpen: false }"> <button @click="isOpen = !isOpen" class="bg-blue-500 hover:bg-blue-700 text-white font-bold py-2 px-4 rounded"> Toggle Component </button> <div x-show.transition="isOpen" class="bg-gray-200 p-4 mt-2"> <!-- Your content here --> This content will toggle with a nice transition effect. </div> </div> One can combine JavaScript commands with Alpine.js effectively. For instance, you can dispatch DOM events when a button is clicked and handle them in Alpine.js: <button phx-click={JS.dispatch("set-slide", detail: %{slide: "chat"})}> Open Chat </button> # Elsewhere in the codebase <div x-data="{ slide: null }" @set-slide-over.window="slide = (slide == $event.detail.slide) ? null : $event.detail.slide" > ... </div> In this example, clicking the button dispatches a custom event (set-slide) with specific data. Alpine.js then listens for and handles this event, demonstrating seamless integration with JavaScript commands in a mixed codebase environment. Check out Alpine.js here. Built-in defaults to enrich client-side interactions LiveView includes client-side features that allow developers to provide users with instant feedback while waiting for actions that may have latency. Some of these features include: phx-disable-with: This feature allows buttons to switch text while a form is being submitted. <button type="submit" phx-disable-with="Updating...">Update</button> The button's innerText will change from "Update" to "Updating..." and restore it to "Update" on acknowledgment. LiveView's CSS classes LiveView includes built-in CSS classes that facilitate providing feedback. For instance, you can dynamically swap form content while a form is being submitted using LiveView's CSS loading state classes. .while-submitting { display: none; } .inputs { display: block; } .phx-submit-loading .while-submitting { display: block; } .phx-submit-loading .inputs { display: none; } <form phx-change="update"> <div class="while-submitting">Please wait while we save our content...</div> <div class="inputs"> <input type="text" name="text" value={@text}> </div> </form> You can learn more about this here. Global events dispatched for page navigation: LiveView emits several events to the browsers and allows developers to submit their events too. For example, phx:page-loading-start and phx:page-loading-stop are dispatched, providing developers with the ability to give users feedback during main page transitions. These events can be utilized to display or conceal an animation bar that spans the page as shown below. // Show progress bar on live navigation and form submits topbar.config({...}) window.addEventListener("phx:page-loading-start", info => topbar.show()) window.addEventListener("phx:page-loading-stop", info => topbar.hide()) Other resources Optimizing user experience in LiveView phx- HTML attributes cheatsheet JavaScript interoperability
Nyakio Muriuki
Post Image

Zero downtime deployments with Fly.io

If you were wondering why you saw the topbar loading for ~5 seconds every time you deployed to Fly.io, you’re at the right place. We need to talk about deployment strategies. Typically, there are several, but Fly.io supports these: immediate rolling bluegreen canary   The complexity and cost go from low to high as we go down the list. The default option is rolling. That means, your machines will be replaced by new ones one by one. In case you only have one machine, it will be destroyed before there’s a new one that can handle requests. That’s why you’re waiting to be reconnected whenever you deploy. You can read more about these deployment strategies at https://fly.io/docs/apps/deploy/#deployment-strategy.   We’re using the blue-green deployment strategy as it strikes a balance between the benefits, cost, and ease of setup.   If you’re using volumes, I have to disappoint you as the blue-green strategy doesn’t work with them yet, but Fly.io plans to support that in the future.   Setup You need to configure at least one health check to use the bluegreen strategy. I won’t go into details. You can find more at https://fly.io/docs/reference/configuration/#http_service-checks.   Here’s a configuration we use: [[http_service.checks]] grace_period = "10s" interval = "30s" method = "GET" path = "/health" timeout = "5s"   Then, add strategy = “bluegreen” under [deploy] in your fly.toml file: [deploy] strategy = "bluegreen" and run fly deploy.   That’s it! You probably expected the setup to be more complex than this. So did I!   Conclusion While Fly.io is moving you from a blue to a green machine, your websocket connection will be dropped, but it will quickly reestablish. You shouldn’t even notice it unless you have your browser console open or you’re navigating through pages during the deployment.   One thing you should keep in mind, though, is that your client-side state (form data) might be lost if you don’t address that explicitly.   Another thing to think about is the way you run Ecto migrations. In case you’re dropping tables or columns, you might want to do that in multiple stages. For example, you might introduce changes in the code so you stop depending on specific columns or tables and deploy that change. After that, you can have subsequent deployment for the structural changes of the database. That way, both blue and green machines will have the same expectations regarding the database structure.   The future will bring us more options for deployment. Recently, Chris McCord teased us with hot deploys.   https://x.com/chris_mccord/status/1785678249424461897   Can’t wait for this!   This was a post from our Elixir DevOps series.
Almir Sarajčić
Post Image

Feature preview (PR review) apps on Fly.io

In this blog post, I explain how we approach manual testing of new features at Optimum.   Collaborating on new features with non-developers often requires sharing our progress with them. We can do quick demos in our dev environment, but if we want to let them play around on their own, we need to provide them with an environment facilitating that. Setting up a dev machine is easy thanks to phx.tools: Complete Development Environment for Elixir and Phoenix, but pulling updates in our projects still requires basic git knowledge.   We could solve this by deploying in-progress stuff to the staging server, but that becomes messy in larger teams, so we stay away from that. Instead, we replicate the production environment for each feature we are working on and we only deploy the main branch with finished features to the staging. With an environment created specifically for the feature we are working on, we can be sure nothing will surprise us after shipping it. Automated tests help with that too, but we still like doing manual checks just before deploying to production.   Heroku review apps Back when I was working on Ruby on Rails apps and websites, as many, I chose Heroku as my PaaS (platform-as-a-service). It had (and still has) a great feature called Review apps. App deployment pipeline on Heroku   It enables you to create new Heroku environments in your pipeline for the PRs in your GitHub repo, either manually through their UI or automatically using a configuration file. You can configure the dynos, environment variables, addons… any prerequisite for running your application. This was a great experience when I worked with Ruby, but when I moved to Elixir Heroku didn’t fit me anymore, so I moved to Fly.io.   Fly.io PR review apps Fly.io introduced something similar using GitHub Actions: https://github.com/superfly/fly-pr-review-apps. It’s not as powerful and is not as user-friendly, but it’s a good starting point for building your workflows. Here’s the official guide: https://fly.io/docs/blueprints/review-apps-guide/.   The current version forces you to share databases and volumes between different PR review apps. We didn’t want that, so last year my colleague Amos introduced a fork that solves this, accompanied by the blog post How to Automate Creating and Destroying Pull Request Review Phoenix Applications on Fly.io. We’ve also added some minor changes there. Some of them were implemented upstream since then, yet the setup for the database and volume is still missing. Here’s the diff: https://github.com/superfly/fly-pr-review-apps/compare/6f79ec3a7d017082ed11e7c464dae298ca75b21b...optimumBA:fly-preview-apps:b03f97a38e6a6189d683fad73b0249c321f3ef4a.   Examples We use preview apps for our phx.tools website. Although it doesn’t use DB and volumes, it’s still a good example of setting preview apps up on Fly.io: https://github.com/optimumBA/phx.tools/blob/main/.github/github_workflows.ex.   Here’s the code responsible for preview apps: @app_name "phx-tools" @environment_name "pr-${{ github.event.number }}" @preview_app_name "#{@app_name}-#{@environment_name}" @preview_app_host "#{@preview_app_name}.fly.dev" @repo_name "phx_tools" defp pr_workflow do [ [ name: "PR", on: [ pull_request: [ branches: ["main"], types: ["opened", "reopened", "synchronize"] ] ], jobs: elixir_ci_jobs() ++ [ deploy_preview_app: deploy_preview_app_job() ] ] ] end defp pr_closure_workflow do [ [ name: "PR closure", on: [ pull_request: [ branches: ["main"], types: ["closed"] ] ], jobs: [ delete_preview_app: delete_preview_app_job() ] ] ] end defp delete_preview_app_job do [ name: "Delete preview app", "runs-on": "ubuntu-latest", concurrency: [group: "pr-${{ github.event.number }}"], steps: [ checkout_step(), [ name: "Delete preview app", uses: "optimumBA/fly-preview-apps@main", env: [ FLY_API_TOKEN: "${{ secrets.FLY_API_TOKEN }}", REPO_NAME: @repo_name ], with: [ name: @preview_app_name ] ], [ name: "Generate token", uses: "navikt/github-app-token-generator@v1.1.1", id: "generate_token", with: [ "app-id": "${{ secrets.GH_APP_ID }}", "private-key": "${{ secrets.GH_APP_PRIVATE_KEY }}" ] ], [ name: "Delete GitHub environment", uses: "strumwolf/delete-deployment-environment@v2.2.3", with: [ token: "${{ steps.generate_token.outputs.token }}", environment: @environment_name, ref: "${{ github.head_ref }}" ] ] ] ] end defp deploy_job(env, opts) do [ name: "Deploy #{env} app", needs: [ :compile, :credo, :deps_audit, :dialyzer, :format, :hex_audit, :prettier, :sobelow, :test, :test_linux_script_job, :test_macos_script_job, :unused_deps ], "runs-on": "ubuntu-latest" ] ++ opts end defp deploy_preview_app_job do deploy_job("preview", permissions: "write-all", concurrency: [group: @environment_name], environment: preview_app_environment(), steps: [ checkout_step(), delete_previous_deployments_step(), [ name: "Deploy preview app", uses: "optimumBA/fly-preview-apps@main", env: fly_env(), with: [ name: @preview_app_name, secrets: "APPSIGNAL_APP_ENV=preview APPSIGNAL_PUSH_API_KEY=${{ secrets.APPSIGNAL_PUSH_API_KEY }} PHX_HOST=${{ env.PHX_HOST }} SECRET_KEY_BASE=${{ secrets.SECRET_KEY_BASE }}" ] ] ] ) end defp delete_previous_deployments_step do [ name: "Delete previous deployments", uses: "strumwolf/delete-deployment-environment@v2.2.3", with: [ token: "${{ secrets.GITHUB_TOKEN }}", environment: @environment_name, ref: "${{ github.head_ref }}", onlyRemoveDeployments: true ] ] end defp fly_env do [ FLY_API_TOKEN: "${{ secrets.FLY_API_TOKEN }}", FLY_ORG: "optimum-bh", FLY_REGION: "fra", PHX_HOST: "#{@preview_app_name}.fly.dev", REPO_NAME: @repo_name ] end defp preview_app_environment do [ name: @environment_name, url: "https://#{@preview_app_host}" ] end   If you’re wondering why you’re seeing Elixir while working with GitHub Actions you should read our blog post on the subject: Maintaining GitHub Actions workflows.   Let’s explain what we’re doing above. We are running the pr_workflow when PR is (re)opened or when any new changes are pushed to it. It runs our code checks and tests, and, if everything passes, runs the deploy_preview_app_job.   GitHub Actions workflow for PRs   The deploy_preview_app_job uses action for deploying preview apps to Fly.io which checks if the server is already set up. If it isn’t, it creates the server, sets environment variables, etc. Then it deploys to it.   Preview app creation job that includes a DB and/or a volume doesn’t differ from the one above at all. That’s because our action optimumBA/fly-preview-apps internally checks whether an app contains Ecto migrations and if it does, it creates a DB if it doesn’t exist yet. The same goes for the volume: it checks whether the fly.toml configuration contains any mounts and if it does, it creates a volume, then attaches it to the app.   GitHub workflow for the website you’re on   Preview app for one of the PRs   We set environment to let GitHub show the preview app in the list of environments. It will show the status of the latest deployment in the PR. We don’t want too much noise in our PR from the deployment messages, so whenever we deploy a new version, we remove previous messages in the delete_previous_deployments_step.   List of deployments on GitHub   Deployment status message in the PR   Setting concurrency makes sure that two deployment jobs can’t run simultaneously for the same value passed to it. That prevents hypothetical race condition with multiple pushes, where for some reason deployment job for the latest commit could finish more quickly than the one for the previous commit, which would leave us with an older version of the app running.   Don’t forget to set GitHub secrets like FLY_API_TOKEN. You might want to do that on the organization level so you don’t have to do that for every repo. The token we’ve set in our GitHub organization is for a Fly.io user we’ve created specifically for deployments to staging and preview apps. We have a separate Fly.io organization it is a part of, so even if the token gets leaked, our production apps are safe as it doesn’t have access to them.   When we’re done working on a feature, we want to clean up our environment. It might seem strange that we use the same action to delete our app, but the action handles it by checking the event that triggered the workflow and acts accordingly. It destroys any associated volume and/or database, then the server. The next two steps of the delete_preview_app_job delete a GitHub environment. For some reason known to GitHub, the process is more complicated than it should be, but Amos explains it well in his blog post.   Getting back to the part about databases. Recently, the upstream version of the action was updated with an option to attach an existing PostgreSQL instance from Fly.io, but that still doesn’t solve potential issues with migrations. Let’s say you remove a table in one PR, while another PR depends on the same table. It will be deleted while deploying the first PR which will in turn cause errors for the second PR’s review app. Our solution avoids that by creating a completely isolated environment for each PR.   Additionally, Fly.io recently introduced (or we’ve just discovered) the ability to stop servers after some time of inactivity. That proved useful for us in lowering the cost when having many PRs open. In your fly.toml you probably want to set [http_service] auto_start_machines = true auto_stop_machines = true min_machines_running = 0   so your machines stop if you don’t access them for some period. We haven’t found a way to stop DBs for inactive apps yet. We weren’t eager to do so, though, because we’ve always had the smallest instances for the preview apps DBs. Only our apps sometimes have larger instances which incur greater costs, so we see a benefit in stopping them when we don’t use them.   More customization Some applications might require setting up additional resources. In the StoryDeck app, one of the services we use is Mux.   When a user uploads a video, we upload it to Mux, which sends us events to our webhooks. Whenever we create a new preview app, we need to let Mux know the URL of our new webhook. In theory, this could be solved by a simple proxy. In reality, it’s more complicated than that. We don’t want all our preview apps to receive an event when a video is uploaded from any of them. To know which preview app to proxy an event to, the proxy app would need to store associations between specific videos and preview apps they were uploaded from, but we don’t want to store that kind of data in the proxy app. Mux enables having many different environments in one account, which is perfect for us as each environment is a container for videos uploaded from one preview app. What is not perfect is the fact that currently there’s no API for managing Mux environments, so we have to do it through the Mux dashboard. We’ve built the proxy app using Phoenix. It has a simple API on which we receive requests sent from GitHub Actions using curl. When a new preview app is created, a request is received, then the app goes through the Mux dashboard using Wallaby, creates a new Mux environment, sets up the webhook URL, gets Mux secrets, and returns it so that the GitHub Actions workflow can set them in our new Fly.io environment. When deleting the preview app, our workflow sends a request to our proxy app which then deletes videos from Mux and deletes the Mux environment.   Creating Mux environment and saving credentials in GitHub Actions cache   That is just one example of what it might take to enable preview apps in your organization. It could seem like unnecessary work, but think of it as an investment into higher productivity and quality of work down the line.   This was a post from our Elixir DevOps series.
Almir Sarajčić
Post Image

Testing Elixir releases in CI

Have you ever deployed your app and called it a day only to find out later that in production some NIF was missing or a 3rd party application wasn’t started? No, that never happens to you because you always run your app locally with MIX_ENV=prod before deploying, right? Right?   Last year I worked on a project with a really conscientious team. We were working on an umbrella project consisting of 6 apps, and a colleague of mine always made sure to build a release for each of them in the prod environment and run it manually on his machine, then deploy it worry-free. It took some time to do that and it was a boring process, so to help him out, I automated the process by building a release and running it for each app in CI. Then, if everything passed, we’d proceed with the deployment.   At Optimum, we usually strive to deploy preview apps assuring us that the app is successfully built and running on a Fly.io server. Sometimes we have a different setup, for which we may build a release as part of our CI.   I’m going to show you how it works in a sample Phoenix app that will execute some code from ExUnit which will be missing in production. The code is available in the repo: https://github.com/almirsarajcic/testing_release.   Failing example Let’s generate a new Phoenix app that consists of only an API endpoint. mix phx.new testing_release --adapter bandit --no-assets --no-ecto --no-esbuild --no-gettext --no-html --no-live --no-mailer --no-tailwind   Create a controller in a new file lib/testing_release_web/controllers/home_controller.ex: defmodule TestingReleaseWeb.HomeController do use TestingReleaseWeb, :controller <p>def index(conn, _params) do ExUnit.<strong>info</strong>(:functions) |&gt; IO.inspect(label: &quot;ExUnit functions&quot;)</p> <pre class="autumn-hl"><code class="language-plaintext" translate="no">json(conn, %{status: &quot;ok&quot;}) </code></pre> <p>end end   add the route scope "/api", TestingReleaseWeb do pipe_through :api <p>get &quot;/&quot;, HomeController, :index end   You can see the full commit here: https://github.com/almirsarajcic/testing_release/commit/378f30c124ca7814e43b8685e57cf350caceb20d.   After setting that up, I can launch a Fly.io server: fly launch --generate-name --vm-memory 256   after it’s been deployed I can visit URL https://old-wave-7774.fly.dev/api and get the following response: {"errors":{"detail":"Internal Server Error"}}   Executing fly logs shows: [error] ** (UndefinedFunctionError) function ExUnit.__info__/1 is undefined (module ExUnit is not available) ExUnit.__info__(:functions) (testing_release 0.1.0) lib/testing_release_web/controllers/home_controller.ex:5: TestingReleaseWeb.HomeController.index/2 (testing_release 0.1.0) lib/testing_release_web/controllers/home_controller.ex:1: TestingReleaseWeb.HomeController.action/2 (testing_release 0.1.0) lib/testing_release_web/controllers/home_controller.ex:1: TestingReleaseWeb.HomeController.phoenix_controller_pipeline/2 (phoenix 1.7.12) lib/phoenix/router.ex:484: Phoenix.Router.__call__/5 (testing_release 0.1.0) lib/testing_release_web/endpoint.ex:1: TestingReleaseWeb.Endpoint.plug_builder_call/2 (testing_release 0.1.0) lib/testing_release_web/endpoint.ex:1: TestingReleaseWeb.Endpoint.call/2 (bandit 1.5.0) lib/bandit/pipeline.ex:124: Bandit.Pipeline.call_plug!/2   but we won’t fix the error yet. Let’s reproduce it in CI.   Automating release process We can use the same Dockerfile generated for us while running fly launch to start a container in GitHub Actions and then send an HTTP request to verify it works as expected. We’ll be using a script github_workflows_generator we introduced in the blog post Maintaining GitHub Actions workflows to write the workflow in Elixir.   Here we’ll focus only on the steps of the workflow, but you can see the full commit on the following link: https://github.com/almirsarajcic/testing_release/commit/65def71031669cf7fcde77918f9b073e95bca4d3.   steps: [ [ name: "Checkout", uses: "actions/checkout@v3" ], [ name: "Set up Docker Buildx", uses: "docker/setup-buildx-action@v1" ], [ name: "Cache Docker layers", uses: "actions/cache@v3", with: [ path: "/tmp/.buildx-cache", key: "${{ runner.os }}-buildx-${{ github.sha }}", "restore-keys": "${{ runner.os }}-buildx" ] ], [ name: "Build image", uses: "docker/build-push-action@v2", with: [ context: ".", builder: "${{ steps.buildx.outputs.name }}", tags: "testing_release:latest", load: true, "build-args": "target=testing_release", "cache-from": "type=local,src=/tmp/.buildx-cache", "cache-to": "type=local,dest=/tmp/.buildx-cache-new,mode=max" ] ], [ # Temp fix # https://github.com/docker/build-push-action/issues/252 # https://github.com/moby/buildkit/issues/1896 name: "Move cache", run: "rm -rf /tmp/.buildx-cache\nmv /tmp/.buildx-cache-new /tmp/.buildx-cache" ], [ name: "Create the container", id: "create_container", run: "echo ::set-output name=container_id::$(docker create -p 4000:4000 -e FLY_APP_NAME=${{ env.FLY_APP_NAME }} -e FLY_PRIVATE_IP=${{ env.FLY_PRIVATE_IP }} -e PHX_HOST=${{ env.PHX_HOST }} -e SECRET_KEY_BASE=${{ env.SECRET_KEY_BASE }} testing_release | tail -1)" ], [ name: "Start the container", run: "docker start ${{ steps.create_container.outputs.container_id }}" ], [ name: "Check HTTP status code", uses: "nick-fields/retry@v2", with: [ command: "INPUT_SITES='[\"http://localhost:4000/api\"]' INPUT_EXPECTED='[200]' ./scripts/check_status_code.sh", max_attempts: 3, retry_wait_seconds: 5, timeout_seconds: 1 ] ], [ name: "Write Docker logs to a file", if: "failure() && steps.create_container.outcome == 'success'", run: "docker logs ${{ steps.create_container.outputs.container_id }} >> docker.log" ], [ name: "Upload Docker log file", if: "failure()", uses: "actions/upload-artifact@v3", with: [ name: "docker.log", path: "docker.log" ] ] ]   Most of the steps are related to setting up Docker for caching intermediary images so that subsequent runs are quicker, but these steps are the most important: [ name: "Start the container", run: "docker start ${{ steps.create_container.outputs.container_id }}" ], [ name: "Check HTTP status code", uses: "nick-fields/retry@v2", with: [ command: "INPUT_SITES='[\"http://localhost:4000/api\"]' INPUT_EXPECTED='[200]' ./scripts/check_status_code.sh", max_attempts: 3, retry_wait_seconds: 5, timeout_seconds: 1 ] ]   After building the image and creating the container, we start it, and then send an HTTP request to it. We’re not sure when the server is ready, so we use nick-fields/retry action to retry sending the request with a configurable number of maximum attempts. To send a request we use a convenient script scripts/check_status_code.sh I copied from https://github.com/lakuapik/gh-actions-http-status.   In the end, we upload a log as an artifact so we can inspect it in case the request fails.   There’s an additional change we have to make to enable running the release outside of Fly.io environment. In the file rel/env.sh.eex replace the line export ERL_AFLAGS="-proto_dist inet6_tcp"   with if [[ -z "${FLY_PRIVATE_IP}" ]]; then export ERL_AFLAGS="-proto_dist inet6_tcp" fi   After pushing the code to GitHub, you can see requests failing. Run nick-fields/retry@v2 step   Checking the log file saved as an artifact docker.log artifact   shows the following error messages: 15:31:02.527 [info] Running TestingReleaseWeb.Endpoint with Bandit 1.5.0 at :::4000 (http) 15:31:02.528 [info] Access TestingReleaseWeb.Endpoint at https://localhost 15:31:07.848 request_id=F8rJ9kxkVangNu4AAAAE [info] GET /api 15:31:07.848 request_id=F8rJ9kxkVangNu4AAAAE [info] Sent 500 in 251µs 15:31:07.849 request_id=F8rJ9kxkVangNu4AAAAE <b>[error]</b> ** (UndefinedFunctionError) function ExUnit.__info__/1 is undefined (module ExUnit is not available) ExUnit.__info__(:functions) (testing_release 0.1.0) lib/testing_release_web/controllers/home_controller.ex:5: TestingReleaseWeb.HomeController.index/2 (testing_release 0.1.0) lib/testing_release_web/controllers/home_controller.ex:1: TestingReleaseWeb.HomeController.action/2 (testing_release 0.1.0) lib/testing_release_web/controllers/home_controller.ex:1: TestingReleaseWeb.HomeController.phoenix_controller_pipeline/2 (phoenix 1.7.12) lib/phoenix/router.ex:484: Phoenix.Router.__call__/5 (testing_release 0.1.0) lib/testing_release_web/endpoint.ex:1: TestingReleaseWeb.Endpoint.plug_builder_call/2 (testing_release 0.1.0) lib/testing_release_web/endpoint.ex:1: TestingReleaseWeb.Endpoint.call/2 (bandit 1.5.0) lib/bandit/pipeline.ex:124: Bandit.Pipeline.call_plug!/2 <br> 15:31:13.856 request_id=F8rJ97J1J9nc0xoAAAAB [info] GET /api 15:31:13.856 request_id=F8rJ97J1J9nc0xoAAAAB [info] Sent 500 in 243µs 15:31:13.856 request_id=F8rJ97J1J9nc0xoAAAAB <b>[error]</b> ** (UndefinedFunctionError) function ExUnit.__info__/1 is undefined (module ExUnit is not available) ExUnit.__info__(:functions) (testing_release 0.1.0) lib/testing_release_web/controllers/home_controller.ex:5: TestingReleaseWeb.HomeController.index/2 (testing_release 0.1.0) lib/testing_release_web/controllers/home_controller.ex:1: TestingReleaseWeb.HomeController.action/2 (testing_release 0.1.0) lib/testing_release_web/controllers/home_controller.ex:1: TestingReleaseWeb.HomeController.phoenix_controller_pipeline/2 (phoenix 1.7.12) lib/phoenix/router.ex:484: Phoenix.Router.__call__/5 (testing_release 0.1.0) lib/testing_release_web/endpoint.ex:1: TestingReleaseWeb.Endpoint.plug_builder_call/2 (testing_release 0.1.0) lib/testing_release_web/endpoint.ex:1: TestingReleaseWeb.Endpoint.call/2 (bandit 1.5.0) lib/bandit/pipeline.ex:124: Bandit.Pipeline.call_plug!/2   The fix for this is simple: change the :extra_applications in the mix.exs file from [:logger, :runtime_tools]   to [:ex_unit, :logger, :runtime_tools]   (https://github.com/almirsarajcic/testing_release/commit/534615eb5dcf0cc19c166971cdeeb23f4ad49708)   After pushing the code, we verify it works. main.yml workflow result   You can also use a database by setting up the Docker container to use the network from the DB service, Redis, and whatnot. Possibilities are vast.   This was a post from our Elixir DevOps series.
Almir Sarajčić
Post Image

Optimum Elixir CI with GitHub Actions

Here’s yet another “ultimate Elixir CI” blog post. We haven’t had one for quite some time. But on a more serious note we have some unique ideas, so continue reading and I’m sure you’ll get some inspiration for your development workflows.   When a post like this comes out, I check it out to see if I can learn about a new tool to use in pursuit of higher code quality, but the thing I get most excited about is reducing the time it takes to get that CI checkmark for my or someone else’s PR. Unfortunately, mostly I realize it’s a twist to an older approach with everything else pretty much the same. I have yet to see one offering a different caching solution. Usually, it’s the same approach presented in the GitHub Actions docs. I saw some downside in their workflows which I’ll explain below, but ours won’t be spared of criticism either. As with anything, the goal is to find the balance, and as our name suggests, we strive to create optimum solutions, so here’s one on us.   A quick reminder: even though here we use GitHub Actions, the principles are also applicable to other types of CIs.   But first, what’s a CI? This article is about a software development practice. For other uses, see Informant. (🙄 I rewatched The Wire recently)   During the development of new features, there comes a time when the developer submits the code for review. At one stage of the code review process, project maintainers want to make sure that the newly written code doesn’t introduce any regressions to existing features. That is, unless they blindly trust the phrase “it works on my machine”. Then, if they are satisfied with the code quality they can merge the pull request and potentially proceed with a release process if there is a continuous delivery (CD) system in place.   CI (continuous integration) system automates the testing process, enabling everyone involved to see which commit introduced a regression early in the workflow, before the reviewer even starts the review process. It frees the project maintainer from having to run the tests (either manually or using an automated system) on their machine, conserving their energy to focus on other aspects of code quality and the business domain. Machines are better at those boring, repetitive tasks, anyway. Let them have it, so they don’t start the uprise.   Crosses and checkmarks show whether the CI passed for the particular commit   Now, if you don’t write and run tests in your Elixir applications, you probably have bigger issues to worry about. So make sure to handle that before going further.   Old approach If you’re just starting to build your CI, you might not be interested in this part and can jump straight to the New approach.   The old approach consists of having all the checks as steps of one job of GitHub Actions workflow. That means commands for the code checks are running one after the other. For example, you might be running the formatter, then dialyzer, and finally, tests.   The good thing about this approach is that the code gets compiled once and then used for each of these steps. You have to make sure, though, that the commands are running in the test environment, either by prefixing the command with MIX_ENV=test or by setting the :preferred_cli_env option to ensure compilation is done only in one environment, otherwise you’d unnecessarily compile in both dev and test environments.   The bad thing is that if one of the commands fails, at that moment you don’t know yet whether the subsequent commands will fail also. So, you might fix the formatting and push the code only to find out minutes later that the tests failed too. Then you have to fix them and repeat the process.   The other bad thing is the caching of dependencies. To understand why, you need to know how the caching works in GitHub Actions. You can learn about that in the official documentation, but here’s the gist of it.   When setting up caching, you provide a key to be used for saving and restoring it. Once saved, cache with specified key cannot be updated. It gets purged after 7 days if it’s not used, or if the total cache size goes above the limit. But you shouldn’t rely on that. The key doesn’t have to match exactly, though. You have an option of using multiple restore keys for partial matching.   Here’s an example from the documentation: - name: Cache node modules uses: actions/cache@v3 with: path: ~/.npm key: npm-${{ hashFiles('**/package-lock.json') }} restore-keys: | npm-   The thing is, that might work for JS community where each run of npm install command causes the lock file to change, making frequent cache updates.   More importantly, when using Elixir, we don’t only want to cache dependencies (deps directory), but also the compiled code (_build). When our application code changes, the cache key isn’t updated, meaning, as time goes by, there will be more changed files that will need to be compiled, making the CI slower and slower. For an active repo, the cache will never get purged, so the only way to reduce the number of files to be compiled each time is to update the lock file, or manually change the cache key, none of which is ideal. Theoretically, the cache might never be refreshed, but in practice, you would probably do an update of dependencies every few months. But still, you need to unnecessarily wait for all the files that were changed since the cache was created to (re)compile.   The issue is multiplied if you extract each command into its own job to enable running them in parallel, but without improving to the caching strategy. That will cause each command to compile all the files in the app that were changed since the cache was created, which for big codebases can be too much, unnecessarily increasing the cost of CI. Not only that, it’s hard to maintain those workflows because GitHub Actions doesn’t have a good mechanism for the reuse of jobs and steps. You can learn how to deal with that in [Maintaining GitHub Actions workflows]().   It’s important to mention that workflows can only access the cache that was created in that branch or in the parent branch. So, if you have a PR open and update the cache there, don’t expect that other PRs will be able to access that cache until that one gets merged. And even then, if you don’t create a cache in the main branch, it won’t be available to other branches. So even if you don’t want to run code checks in the main branch, you should at least cache the dependencies as part of the CI workflow. I saw some examples of CIs that didn’t cache dependencies on the main branch which means caching didn’t exist the first time PRs were created - only when it was synced.   Another example of inadequate setup is not using restore keys and matching on the complete cache key. That forces the whole app including all the dependencies to be recompiled every time the lock file changes.   Workflow running the old way   Run and billable time of the old approach New approach I won’t go too much into explaining what we do. One Look is Worth A Thousand Words. Workflow running the new way   The work is parallelized so the time waiting for the CI is shortened. Compiling is done only once in a job, and then cached for use by all the other jobs. Jobs that don’t depend on the cache run independently. Every job is running in the test environment to prevent triggering unnecessary compilation. It’s possible to see from the list of commits which check has failed.   Checks running separately   Those were the benefits. Now let’s talk about the detriments of this approach:   It’s using too much cache. There’s a 10 GB limit in GitHub Actions, and the old cache is automatically evicted. So, that doesn’t worry me much. Issues could arise from using cache instead of running a fresh build in CI. The old approach is susceptible to this as well, but I guess this one is more because it provides better caching 😁What we could do to improve this is to disable using cache on retries. Or we could manually delete the cache from the GitHub Actions UI. We didn’t need either of those yet.   Cache management under the Actions tab   It’s more expensive. The workflow running this way uses more runner minutes. You’d expect it’s because of the containers being set up, but GitHub doesn’t bill us for the time it takes to set up their environment. Thanks, GitHub! They get us the other way, though: when rounding minutes, they are ceiling, and that’s what makes all the difference. Even if the job finishes in 10 seconds, it’s billed as a whole minute, so if you have 10 steps that are each running in 10 to 30 seconds, you’ll be billed 10 minutes even though the whole workflow might have been completed in one job running under 5 minutes. You can see that most of our jobs are running for less than half a minute, but we get billed for the whole minute. In our projects, we still go under the quota, so it wasn’t a concert for us, but it’s something to be aware of. If you use a macOS runner and/or have a pretty active codebase, you will notice the greater cost.   Run and billable time of the new approach   Now that we have cleared that, let’s see some code.   We solved the caching part by using git commit hash as the key and using a restore key that enables restoring cache, while still creating a new one every time the workflow runs.   [ uses: "actions/cache@v3", with: [ key: "mix-${{ github.sha }}", path: ~S""" _build deps """, "restore-keys": ~S""" mix- """ ] ]   You can verify by looking at the logs.   For the caching step, this would show something like this: Cache restored successfully Cache restored from key: mix-4c9ce406f9b55bdfa535dac34c1a9dbb347dd803   but it would still show this in the post-job cache step: Cache saved successfully Cache saved with key: mix-83cb8d66280ccf99207c202da7c6f51dfc43fa38   Our solution for the jobs parallelization is harder to show: defp pr_workflow do [ [ name: "PR", on: [ pull_request: [ branches: ["main"], ] ], jobs: [ compile: compile_job(), credo: credo_job(), deps_audit: deps_audit_job(), dialyzer: dialyzer_job(), format: format_job(), hex_audit: hex_audit_job(), migrations: migrations_job(), prettier: prettier_job(), sobelow: sobelow_job(), test: test_job(), unused_deps: unused_deps_job() ] ] ] end defp compile_job do elixir_job("Install deps and compile", steps: [ [ name: "Install Elixir dependencies", env: [MIX_ENV: "test"], run: "mix deps.get" ], [ name: "Compile", env: [MIX_ENV: "test"], run: "mix compile" ] ] ) end defp credo_job do elixir_job("Credo", needs: :compile, steps: [ [ name: "Check code style", env: [MIX_ENV: "test"], run: "mix credo --strict" ] ] ) end   Another benefit of splitting the workflow into multiple jobs is that the cache is still written even if some of the checks fail. Before, everything would still need to be recompiled (and PLT files for dialyzer created - I know, I know, I’ve been there) every time the workflow runs after failing. It could be solved another way by saving the cache immediately after compiling the code and then running the checks in the same job. Just saying.   But hold on a minute. Are we writing our GitHub Actions workflows in Elixir?! That can’t be right… It’s not magic, it’s a script we wrote to maintain GitHub Actions more easily.   Full example of a complex workflow we made for our phx.tools project is available here: https://github.com/optimumBA/phx.tools/blob/main/.github/github_workflows.ex, and here you can see it in action(s): https://github.com/optimumBA/phx.tools/actions.   Running the checks locally We don’t rely only on GitHub Actions for the code checks. Usually, just before committing the code, we run the checks locally. That way we find errors more quickly and don’t unnecessarily waste our GitHub Actions minutes.   To execute them all one after the other, we run a convenient mix ci command. It’s an alias we add to our apps that locally runs the same commands that are run in GitHub Actions.   defp aliases do [ ... ci: [ "deps.unlock --check-unused", "deps.audit", "hex.audit", "sobelow --config .sobelow-conf", "format --check-formatted", "cmd --cd assets npx prettier -c ..", "credo --strict", "dialyzer", "ecto.create --quiet", "ecto.migrate --quiet", "test --cover --warnings-as-errors", ] ... ]   When one of these commands fails, we run it again in isolation and try fixing it while rerunning the command until the issue is fixed. Then we run mix ci again until every command passes.   To run each of these commands without having to prefix with MIX_ENV=test, you can pass the :preferred_cli_env option to the project/0:   def project do [ ... preferred_cli_env: [ ci: :test, coveralls: :test, "coveralls.detail": :test, "coveralls.html": :test, credo: :test, dialyzer: :test, sobelow: :test ], ... ] end   Again, the reason why I run these commands in the test environment is that the app is already compiled in that environment and if I need to run it in the dev environment, it will start the compilation. Locally, it doesn’t matter much, but in GitHub Actions, as you’d expect, it makes a huge difference.   Usually in our projects, we also like to check whether all migrations can be rolled back. To achieve that, we run the command mix ecto.rollback --all --quiet after these. Unfortunately, it doesn’t work if it’s added to the end of this list because when the command is run the app is still connected to the DB causing it to fail. Don’t worry, there’s a tool that can help us, and it’s available in any Unix system. Yes, it’s Make. Create a Makefile in the root of your project with the following content:   ci: mix ci MIX_ENV=test mix ecto.rollback --all --quiet   and run make ci. We could put all the commands there instead of creating a mix alias, something like:   ci.slow: mix deps.unlock --check-unused mix deps.audit mix hex.audit mix sobelow --config .sobelow-conf mix format --check-formatted mix cmd --cd assets npx prettier -c .. mix credo --strict mix dialyzer MIX_ENV=test ecto.create --quiet MIX_ENV=test ecto.migrate --quiet test --cover --warnings-as-errors MIX_ENV=test mix ecto.rollback --all --quiet   but I prefer doing it as a mix alias as it performs more quickly.   See for yourself: $ time make ci … make ci 18.88s user 3.39s system 177% cpu 12.509 total $ time make ci.slow make ci.slow 22.08s user 4.92s system 157% cpu 17.180 total   Almost 5 seconds difference. I suspect it’s because the app is booted only once, unlike when running make ci.slow with each mix ... command booting the app again. Now it makes sense why the rollback step didn’t work when it was a part of the ci alias.   Need help? You’re probably reading this because you’re just starting to build your CI pipeline, or maybe you’re looking for ways to make the existing one better. In any case, we’re confident we can find ways to improve your overall development experience.   We’ve done more complex pipelines for our clients and in our internal projects. These include creating additional resources during the preview apps setup, running production Docker container build as a CI step, using self-hosted runners, etc. We can create a custom solution suitable to your needs.   Whether you’re just testing out your idea with a proof-of-concept (PoC), building a minimum viable product (MVP), or want us to extend and refactor your app that’s already serving your customers, I’m sure we can help you out. You can reach us at projects@optimum.ba.   This was a post from our Elixir DevOps series.
Almir Sarajčić
Post Image

Elixir DevOps series

Everyone who’s dipped their toes in Elixir knows its ecosystem has the best-in-class documentation, and learning resources for beginners are vast. There are so many blog posts about various domains Elixir is used in, including, but not limited to machine learning, embedded systems, web applications, etc.   One area we felt didn’t receive much love is DevOps. Specifically, complex continuous integration (CI) and continuous delivery (CD) systems. So here we are, coming up with a remedy. We’re trying to shine some light on some non-trivial problems to share knowledge with the community we learned a lot from, while, simultaneously increasing the visibility of our company in the field.   Blog posts So here they are, in the order they were published - not necessarily in the order they should be read.   Maintaining GitHub Actions workflows Optimum Elixir CI with GitHub Actions Testing Elixir releases in CI Feature preview (PR review) apps on Fly.io Zero downtime deployments with Fly.io   The list is not final and we might add more posts in the future.   Is there some topic that you’d like us to cover in this series? Feel free to reach us at blog@optimum.ba.
Almir Sarajčić

Portfolio

  • Phx.tools

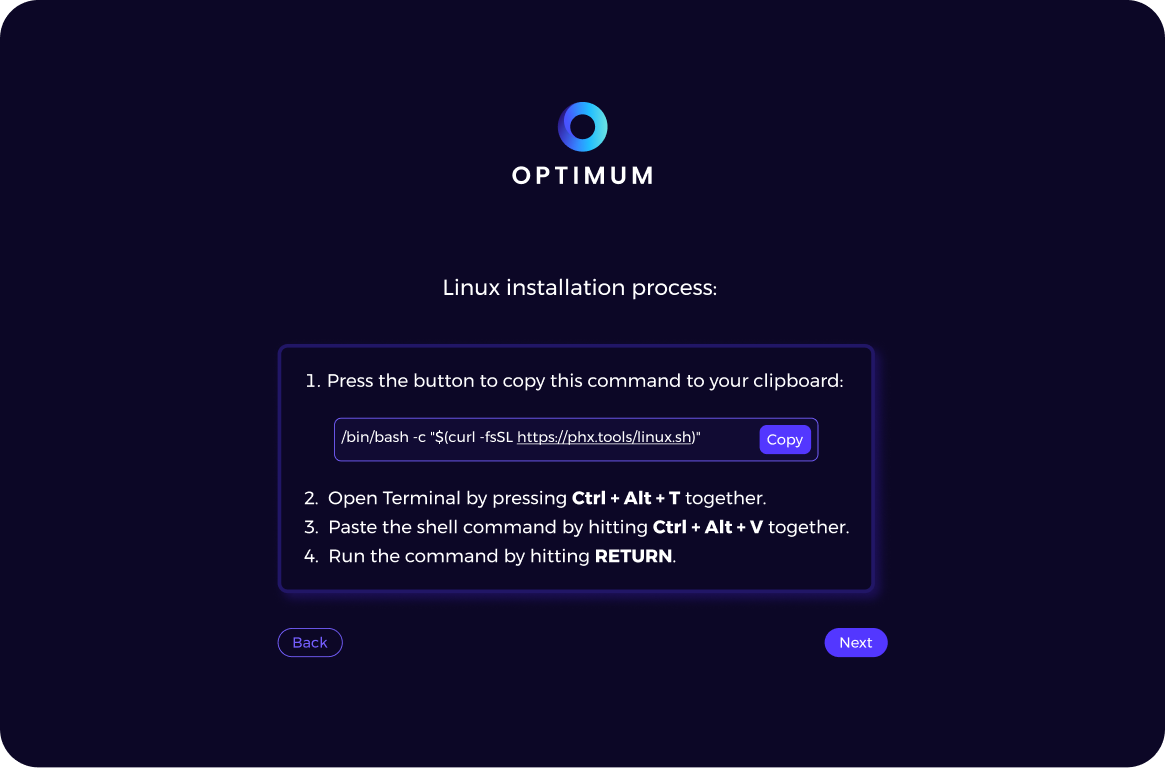
    Powerful shell script designed for Linux and macOS that simplifies the process of setting up a development environment for Phoenix applications using the Elixir programming language. It configures the environment in just a few easy steps, allowing users to start the database server, create a new Phoenix application, and launch the server seamlessly. The script is particularly useful for new developers who may find the setup process challenging. With Phoenix Tools, the Elixir ecosystem becomes more approachable and accessible, allowing developers to unlock the full potential of the Phoenix and Elixir stack.

    Phx.tools
  • Prati.ba

    Bosnian news aggregator website that collects and curates news articles from various sources, including local news outlets and international media. The website provides news on a variety of topics, including politics, sports, business, culture, and entertainment, among others.

    Prati.ba
  • StoryDeck

    StoryDeck is a cloud-based video production tool that offers a range of features for content creators. It allows users to store and archive all their content in one location, track tasks and collaborate easily with team members, and use a multi-use text editor to manage multiple contributors. The platform also offers a timecode video review feature, allowing users to provide precise feedback on video files and a publishing tool with SEO optimization capabilities for traffic-driving content.

    StoryDeck